
Last week I was delighted to have the opportunity to share some of my engineering leadership experiences with over 24 CEOs and their engineering leaders. I presented an online webinar on the topic of “Metrics That Matter” hosted by private equity firm Pacific Lake Partners which invests in search fund entrepreneurs and their journey to acquire and build a technology company. A special thanks to Scott Barstow, on the Value Creation Team for reaching out and asking me to present to their group of companies and also helping with some of the slides.
The topic of Metrics that Matter is popular among CEOs and their engineering leaders because all the companies that they are leading have big initiatives for accelerating growth. After all, how do you improve what you can’t measure? In other words, if we start to make organizational changes how do we know those changes are moving the needle in the right direction and supporting overall business outcomes? I shared my perspectives as a leader who’s led engineering teams through 5 M&As totalling over 55MM in investments.
Key Takeaway – From an engineering perspective, what KPIs should we track and how do we ensure they support the overall company objectives? In the following diagram I shared during the webinar, I use the management methodology known as OKRs. However, the same could be drawn for similar frameworks like Management by Objectives (MBO), or the Balanced Scorecard. I recommend reading Measure What Matters by John Doerr, which is a great book to learn about OKRs.
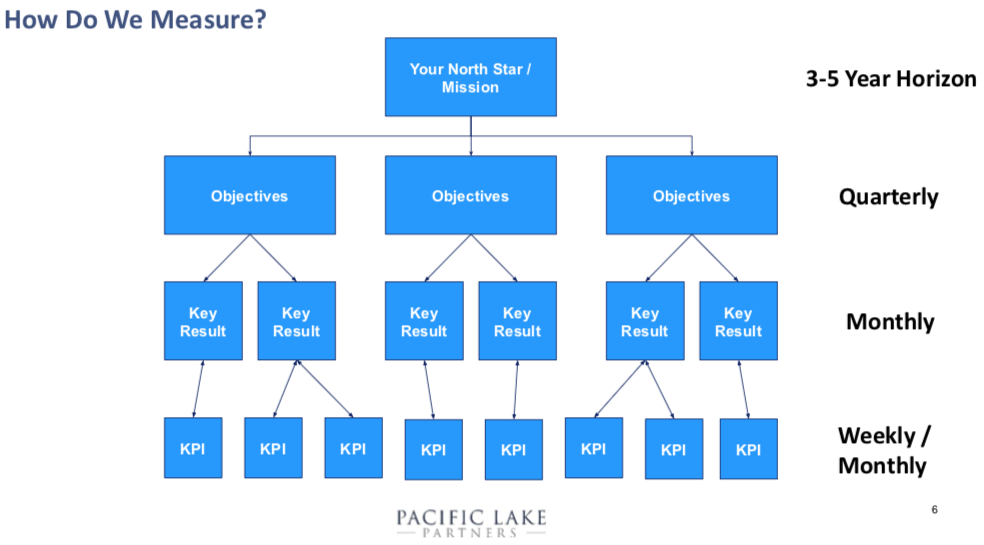
Summary of Diagram – At the top of the diagram, every company should have a big audacious goal set out with a long term horizon (usually 3-5 years). This mission, or north star, establishes the overall direction and singular focus for the company. The next two rows, represent the OKR process. This strategic management process helps align individual and team goals with overall company objectives, while providing visibility and accountability for everyone in the organization. Typically this planning happens annually with objectives broken down into quarterly and monthly meetings to measure key result outcomes. The bottom row represents the teams KPIs which are a set of metrics tracked over time that gives the team an overview of their performance. These KPIs are often tracked weekly, bi-weekly, or monthly depending on the team and their preferred cadence. I won’t go into the process details at each level as there are lots of courses, books, and blogs you can read on those topics.
My Recommendations:
- Make sure that your KPIs “show up” and inform a business Objective via a Key Result on a regular basis or should be considered for removal. Sometimes a KPI will not inform and be tied to a Key Result, but that should be the exception not the norm. If there are KPIs that the team feels will help them keep tabs on their own performance and help identify actionable insights, they should be tracked internally (inside the team or area of competence only) and not part of this overall company process and reporting.
- Make it comprehensive – I’ve seen instances where the company only performs OKRs and tracks KPIs but lacks the top level (mission/north star) which helps everyone in the company, including individual contributors, understand the big picture and their purpose. Ever hear of the story of the three bricklayers and the parable about the power of purpose?
- Educate everyone in the company – This process is not just for managers/directors and up. It should be taught company wide and part of the new employee on-boarding schedule. It will help new and existing developers, who are working on a feature or fixing a bug (“the what”), understand the bigger purpose of what they are doing (“the why”).
- Evolutionary not one-and-done – Every company will be different and every product will have its own set of KPIs that eventually tie into a key result to support an objective. What I’ve found works is try and measure some well known KPIs and test it for a few months to make sure it provides value. Do a retrospective on it . If it can’t pass the scrutiny of the team and support a key result, either remove it. Or keep it internal to the team only as mentioned in the first point. Over time, you should end up with a tight set of KPIs that are meaningful and provide the best value to support company objectives, and overall the mission of the company. And evolve them continuously as the business evolves.
Some examples to try:
Look up these KPIs to find out more about them, I’ve included the names but left out their descriptions and purpose for brevity of this writeup.
- Code coverage
- Bugs outstanding (sev1,2,3)
- Bugs fixed vs reported
- Deployments per week/month
- Points delivered vs committed (or Value delivered – going beyond velocity)
- Cycle time (vs lead time)
- Escaped defects
- Uptime
- Response times
- Hosting costs/client
- Team happiness
- Pull requests (average time to merge)
- … likely a lot more but try these to see how they fit in your organization if you’re not already using them!
KISS – Remember to keep the list of KPIs as small and as simple as you can. Through team scrutinization (retrospectives), remove the ones that are not providing value as the business changes. Automate tracking of these KPIs whenever you can. If your team leads/managers are spending more than 1-2 hours a month gathering KPIs then that’s probably not as valuable anymore (the law of diminishing returns).
Thanks again to all the CEOs and engineering leaders from the Pacific Lake companies that set aside over an hour of their time to listen and challenge me with questions to help their company!

